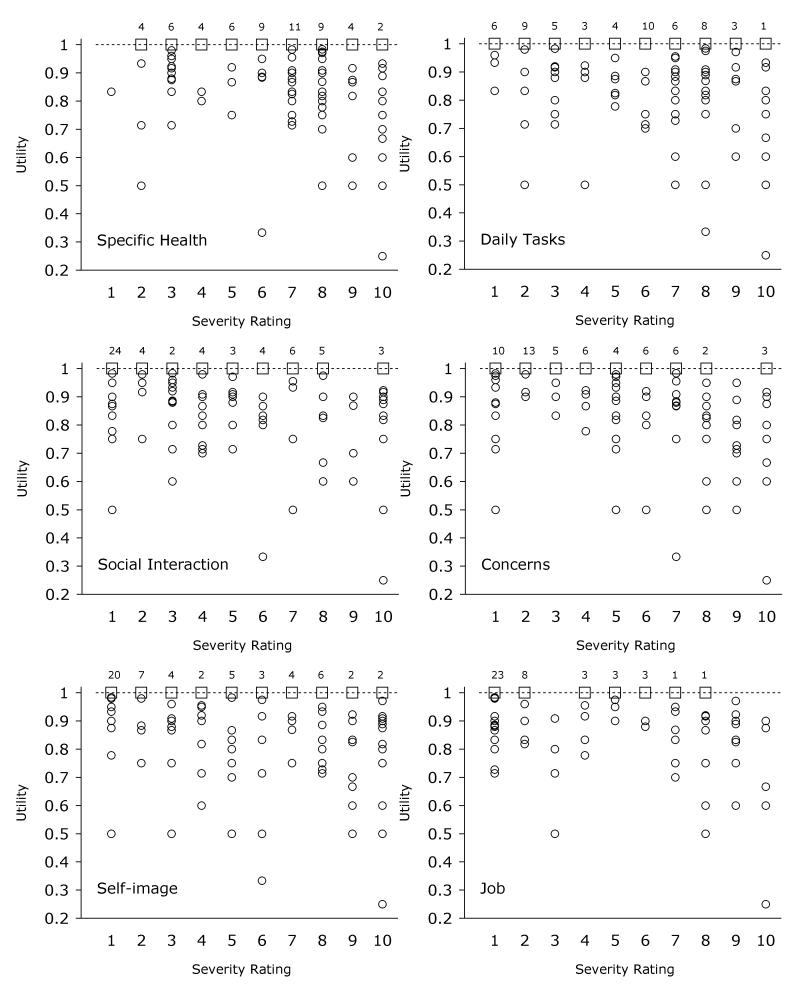
FIGURE 3.
Scatter plots showing the relationships between time tradeoff utility values and each of the six severity ratings of patient-perceived disability in adults with strabismus. For clarity, multiple overlapping data points at 1.0 utility were replaced by single open squares with labels indicating the number of overlapping points in the original database. For utility values less than 1.0, open circles represent individual patients.

