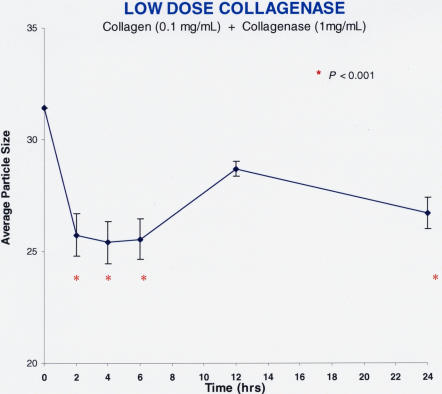
FIGURE 14A.
Low-dose collagenase effects on model solutions of collagen. Each data point represents the average of five specimens run simultaneously, and the error bars signify the standard deviation of the mean. Statistics compare each point to time zero, and significance (P < .001) is indicated by the red asterisks. Within 2 hours of administration, collagenase decreased vitreous average particle size (arbitrary units) to statistically significant levels, with a maximum effect of a little less than 20%.

