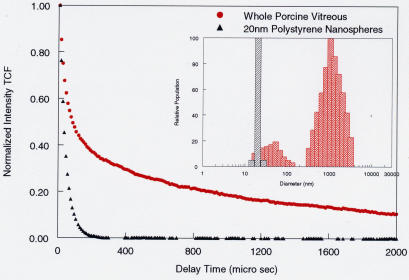
FIGURE 6.
Time correlation function (TCF) of whole porcine vitreous. For dilute dispersions of particles, the slope of the TCF provides an accurate determination of the particle’s translation diffusion coefficient, which is related to its size (see Stokes-Einstein equation (4), Appendix A). Compared to a solution of 20-nm polystyrene beads (black curve), porcine vitreous has two components to the TCF (red curve), indicating polydispersity. The solution of nanospheres has only one component (monodisperse) that is very fast because of the small size and perfectly spherical shape of the beads, enabling very rapid Brownian movements in the solution. The histograms in the inset display the particle size distributions of these DLS measurements. The group of bars around 1,000 nm diameter correspond to the larger, stiffer (and thus slower moving or diffusing) collagen macromolecules, whereas those around 80 to 100 nm correspond to the smaller, more flexible (and thus faster moving or diffusing) hyaluronan macromolecules. The black bar indicates the 20-nm polystyrene beads, for reference.

