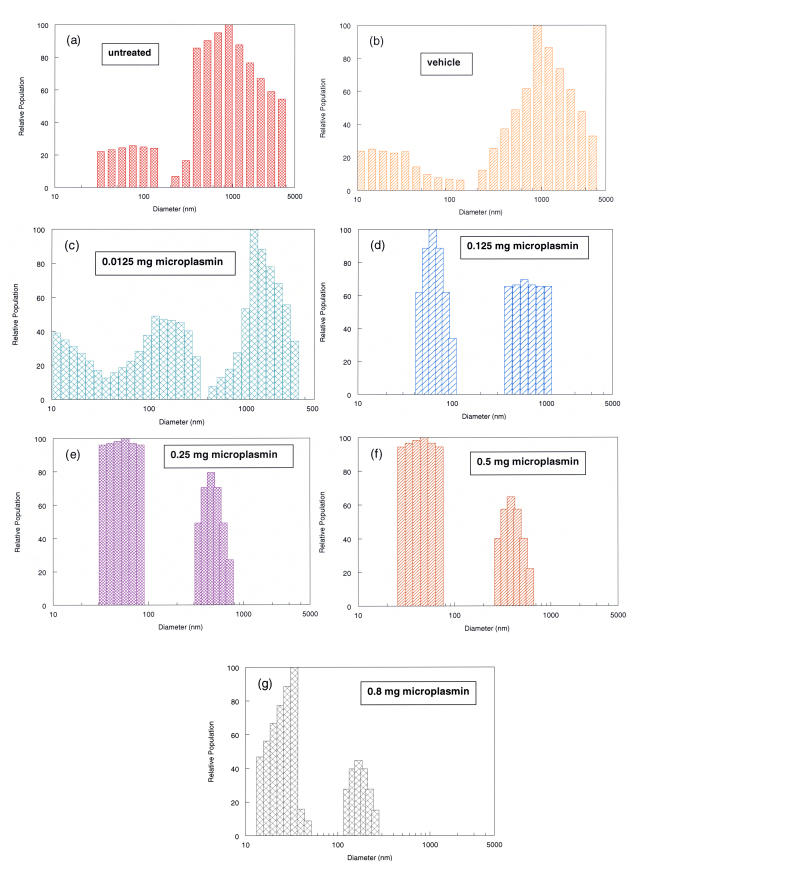
FIGURE 9.
Particle size distribution of porcine vitreous macromolecules following microplasmin pharmacologic vitreolysis. Controls (a = untreated, b = vehicle) and various doses of microplasmin (c = 0.0125 mg, d = 0.125 mg, e = 0.25 mg, f = 0.5 mg, g = 0.8 mg) were injected into intact porcine eyes. After 30 minutes incubation at 37°C, the anterior segment was excised and dynamic light-scattering (DLS) measurements were made at multiple sites along the optical and horizontal axes as described in the “Methods” section. The histograms were derived from the time correlation function (TCF) curves (as shown in Figure 6) and demonstrate the particle size distributions at different doses. Compared with lower doses of microplasmin (c and d), higher doses of microplasmin (f and g) are associated with a shift to left in the particle size distributions, representing a breakdown in vitreous macromolecules. Note that whereas controls (a and b) and low-dose specimens (c and d) have a considerable representation of macromolecules in the 1,000-nm range, at the 0.5-mg (f) and 0.8-mg (g) doses there are no longer any particles in the 1,000-nm range.

