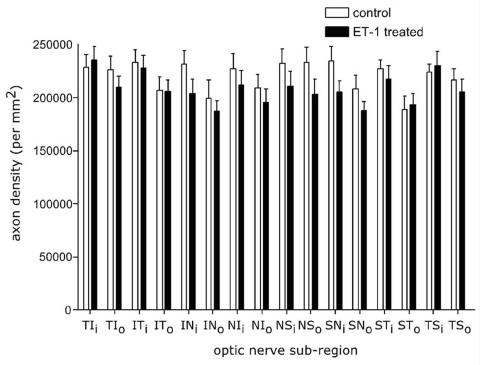
FIGURE 5.
The histogram demonstrates the average regional retinal ganglion cell axonal density differences (axons/mm2) between the endothelin-1 (ET-1) treated eye and the contralateral eyes of 12 animals. Although the ET-1 treated eyes had significant loss of axons for the entire optic nerve, for the entire population regionally the differences were not significant (T = temporal, S = superior, I = inferior, N = nasal, i = inner, o = outer). Reprinted with permission from Archives of Ophthalmology.132

