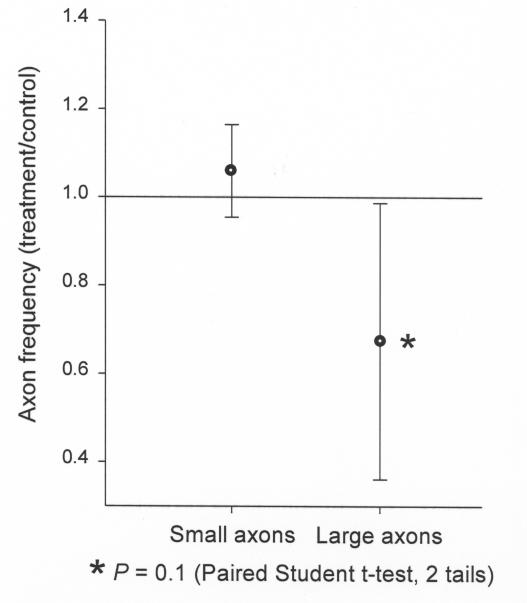
FIGURE 9.
Mean large versus small axonal changes for the entire group of five animals illustrated in Figure 8 (M1, M4, M5, M7 and M11). As a group, the mean axonal frequency changes of large and small axons between the endothelin-1 treated and the control optic nerves were compared and do not show significant differences (P = .1) This is likely due to the high variability in the axonal sizes, the varying degrees of axonal loss in each animal, and the small sample size. However, there appears to be a tendency toward preferential large axonal loss.

