
Figure 2.
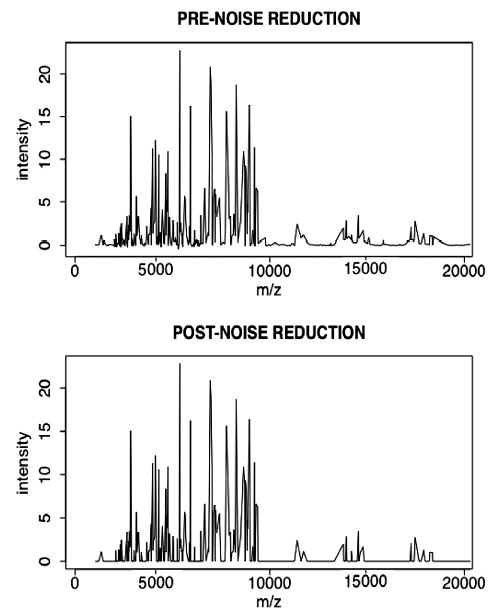
A representative MS spectrum of a urine sample before and after application of a noise-reduction approach for which the peak-defining threshold is based upon the nadir of the bimodal distribution of the spectrum’s MS intensities.
Official websites use .gov
A
.gov website belongs to an official
government organization in the United States.
Secure .gov websites use HTTPS
A lock (
) or https:// means you've safely
connected to the .gov website. Share sensitive
information only on official, secure websites.
A representative MS spectrum of a urine sample before and after application of a noise-reduction approach for which the peak-defining threshold is based upon the nadir of the bimodal distribution of the spectrum’s MS intensities.