
Figure 3.
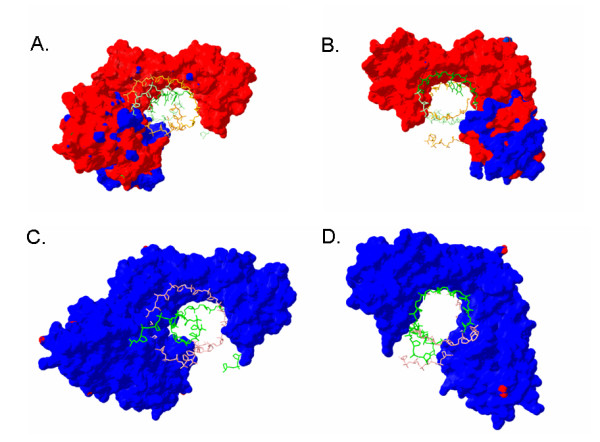
Surface charge comparisons of the TBP-TFB-DNA complexes in Halobacterium and Homo sapiens. Acidic character of proteins is indicated by red and basic by blue. DNA strands are green (coding) and pink or orange (non-coding). Panels A and B show the modeled complex in Halobacterium using a dielectric constant of 48.4 (NaCl concentration of 5 M) while panels C and D show the Homo sapiens complexes using a dielectric constant of 80.0 (NaCl concentration of 0 M). Panels A and C show transcription going into the plane while B and D show transcription coming out of the plane.