Figure 1.—
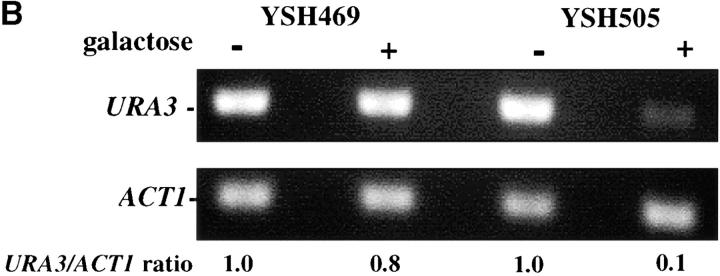
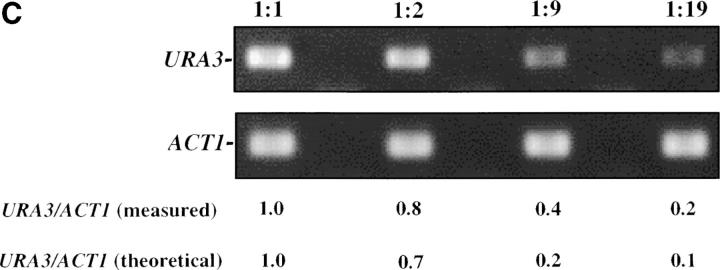
Inducible silencing at a yeast telomere. (A) Strains YSH469 and YSH505 were grown to log phase in media containing raffinose. Serial dilutions of these cultures were then spotted on nonselective glucose plates (SDC), glucose plates selecting for expression of the URA3 gene (SDC-URA), or galactose plates selecting for URA3 expression (SCgal-URA). Plates were incubated at 30° for 3 days. (B) Levels of URA3 and ACT1 mRNA were measured by RT-PCR in strains YSH469 and YSH505 grown to steady state in raffinose media with or without galactose. Levels of URA3 expression were quantified by determining the ratio of the URA3 band to the control ACT1 band; values are given below each lane, expressed relative to the appropriate uninduced (no galactose) control. (C) RT-PCR controls. cDNA from YSH505 was mixed with cDNA made from a congenic strain lacking the URA3 gene at the ratios indicated at the top of each lane. RT-PCR measurements were made from these samples (see materials and methods). The bands were quantified, and the URA3/ACT1 ratio for each lane is shown, expressed relative to the uninduced (no galactose) control. These results demonstrate that this assay can detect subtle differences in URA3 message in this range and indicate that the degree of repression of URA3 in YSH505 following galactose induction of Sir3p is ∼10-fold. (D) Kinetics of repression. A culture of YSH505 was grown to log phase in raffinose media. Galactose was added to 2% at time 0. URA3 message levels were determined at several time points following addition of galactose; time in hours following addition of galactose to induced cultures is listed on top of the figure. For each lane the URA3/ACT1 ratio is shown, as determined by quantification of the bands and expressed relative to the uninduced (no galactose) control.


