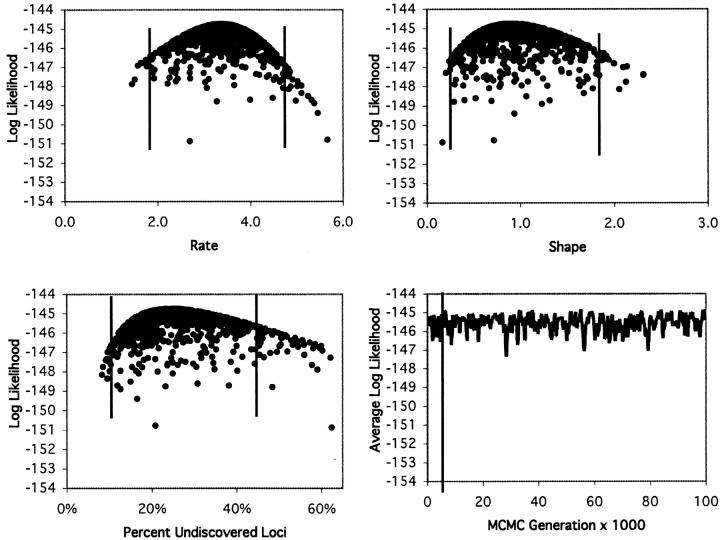
Figure 4.—
Log-likelihood values for the Nüsslein-Volhard data set as in Figure 3, but for the gamma model. Distributions are shown for the rate and shape parameters and for the percentage of undiscovered loci. Also shown is the average log-likelihood over the course of the chain, with the vertical line representing the (probably unnecessary) burn-in cutoff at the 50th sample.

