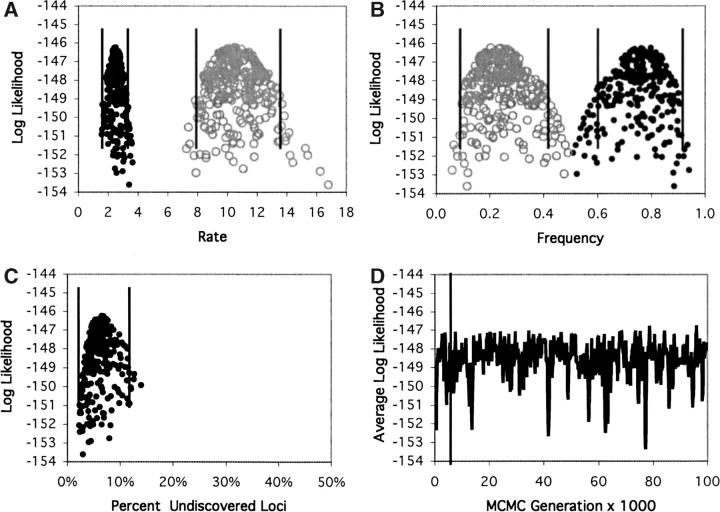
Figure 5.—
Log-likelihood values for the Nüsslein-Volhard data set as in Figure 3, but for the two-rate-class model with variable frequencies. Distributions are shown for (A) the rate and (B) frequency parameters, for (C) the percentage of undiscovered loci, and for (D) the likelihood over the course of the chain, as in Figure 4.

