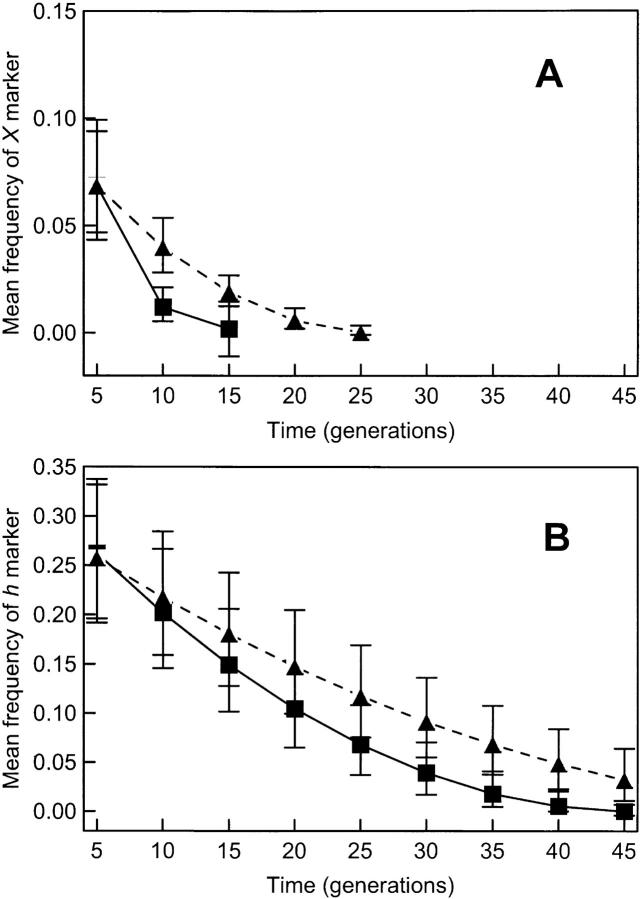
Figure 2.—
Loss through time of virus mutants in populations propagated in the presence and absence of co-infection. Each point is the back-transformed least-squares mean frequency (±95% C.I.) of marked viruses in three replicate populations evolved at MOI = 2 (triangles) or MOI = 0.0001 (squares). Populations started with wt φ6-, X-, h-, and ts-marked viruses at an initial ratio of ∼1:1:1:1. (A) Trajectory for X mutants; (B) trajectory for h mutants. In all cases mutations disappear faster in the absence of co-infection.

