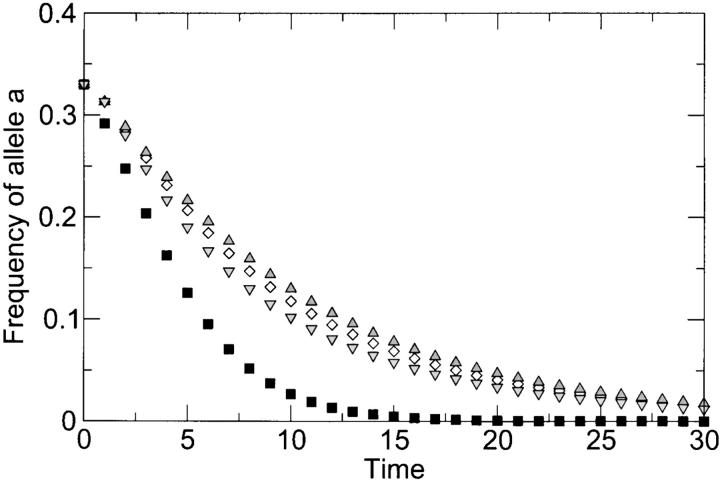
Figure 4.—
Loss of allele a as a function of time (in generations), as predicted by the more realistic reassortment model of appendix B. Squares correspond to the case with no co-infection (r = 0), and all other points correspond to the case of frequent co-infection (r = 0.69, equivalent to an MOI of 2) and various levels of epistasis. Initial frequencies of genotypes AB, aB, and Ab were 1:1:1. Deleterious effects were sa = sb = 0.3 and sab = 0.51 (diamonds, no epistasis), sab = 0.3 (upward-facing triangles, extreme case of positive epistasis), and sab = 1.0 (downward-facing triangles, extreme case of negative epistasis). The curve for r = 0 is independent of sab (and thus of the level of epistasis) because the double mutant is absent from the initial population and cannot be generated later on. The model predicts faster loss of deleterious alleles in the absence of co-infection.

