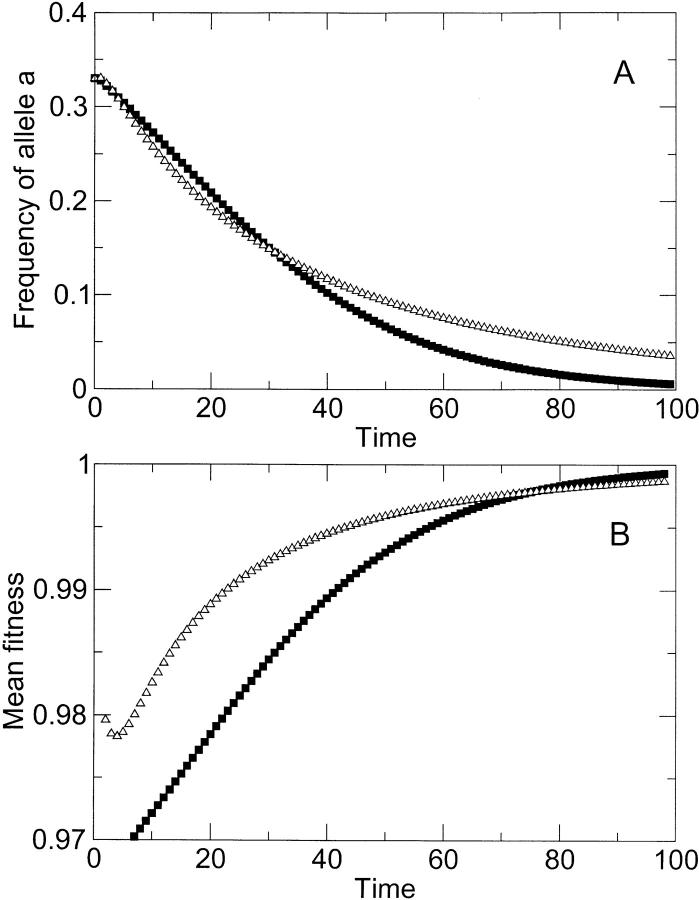
Figure 5.—
(A) Loss of allele a as a function of time (in generations), as predicted by the model of appendix B. Squares correspond to the case with no co-infection (r = 0), and triangles correspond to the case of frequent co-infection (r = 0.69, equivalent to an MOI of 2). In contrast to the case of Figure 4, single mutants were only slightly deleterious. (Deleterious effects were sa = sb = 0.05, sab = 0.3; initial frequencies of genotypes were as in Figure 4.) The model predicts slower loss of abundant and faster loss of rare slightly deleterious alleles in the presence of co-infection. (B) Mean population fitness (per infected cell) in the simulations displayed in A (squares correspond to r = 0, and triangles correspond to r = 0.69).

