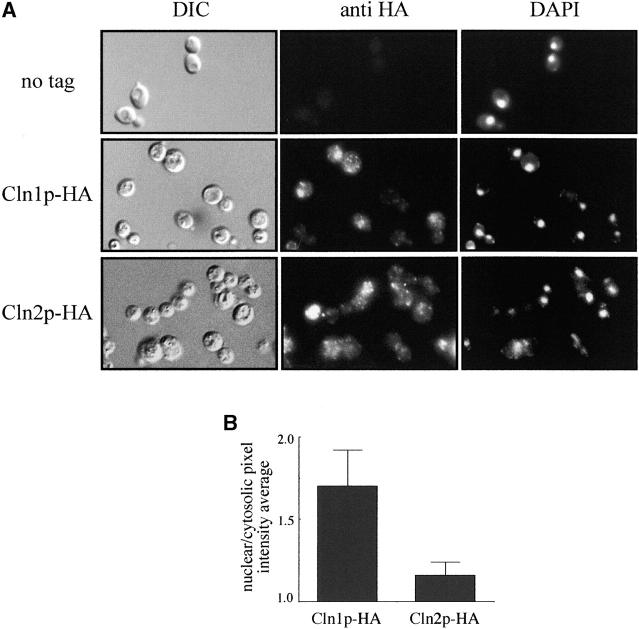
Figure 5.—
Subcellular localization of Cln1p and Cln2p. (A) Cells from exponentially growing cultures of the cln1 (JCY275) or the cln2 mutant (JCY296) strains transformed with a centromeric plasmid expressing an HA-tagged version of either Cln1p or Cln2p, respectively, were assayed by indirect immunofluorescence as described in materials and methods. DIC images, the Cln1p-HA and Cln2p-HA indirect-fluorescence signals (anti-HA), and the DAPI staining of DNA are shown. The first row corresponds to a control of the untagged wild-type strain. (B) A comparison of the relative distribution of Cln1p and Cln2p between the nucleus and the cytoplasm was achieved by determining the ratio of the average pixel intensity in the nuclear and cytosolic regions of the cell.

