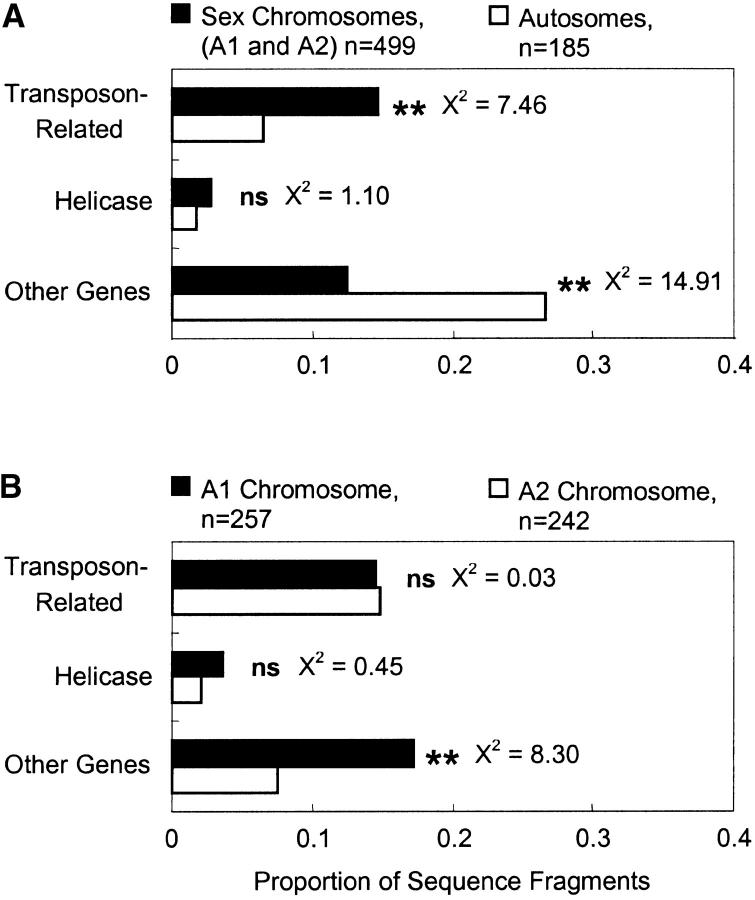
Figure 1.—
Densities of identified sequences from M. violaceum. Indications of statistical significance (**) are at the level of P < 0.01 with 1 d.f.; the smallest P-value among nonsignificant tests was 0.29. (A) Comparison between the fungal sex chromosomes and autosomes. (B) Comparison between the A1 and A2 fungal sex chromosomes.

