
Figure 3.—
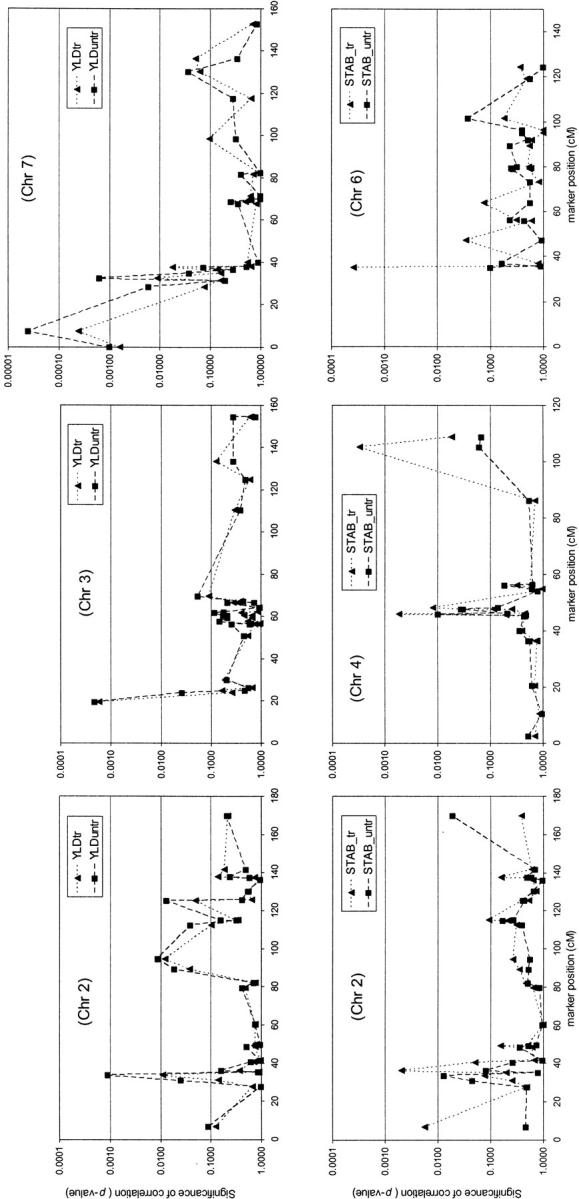
Association profiles showing the P-values of correlation between marker and trait against the position of the marker on the chromosome. (Top) Yield on chromosomes 2, 3, and 7. (Bottom) Yield stability on chromosomes 2, 4, and 6.
Official websites use .gov
A
.gov website belongs to an official
government organization in the United States.
Secure .gov websites use HTTPS
A lock (
) or https:// means you've safely
connected to the .gov website. Share sensitive
information only on official, secure websites.
Association profiles showing the P-values of correlation between marker and trait against the position of the marker on the chromosome. (Top) Yield on chromosomes 2, 3, and 7. (Bottom) Yield stability on chromosomes 2, 4, and 6.