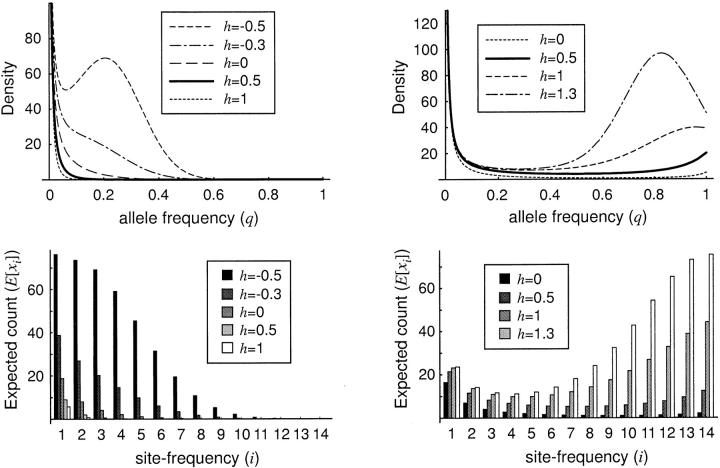
Figure 1.—
The stationary distribution of allele frequencies (top row) and the expected site-frequency spectrum (bottom row) for various values of the dominance parameter, h, and the selection parameter, γ. The left-hand column depicts the case of negative selection (γ = −10), and the right-hand column depicts the case of positive selection (γ = 10). The expected site-frequency spectra were generated with n = 15 and the scaled mutation parameter was set at θ = 20.

