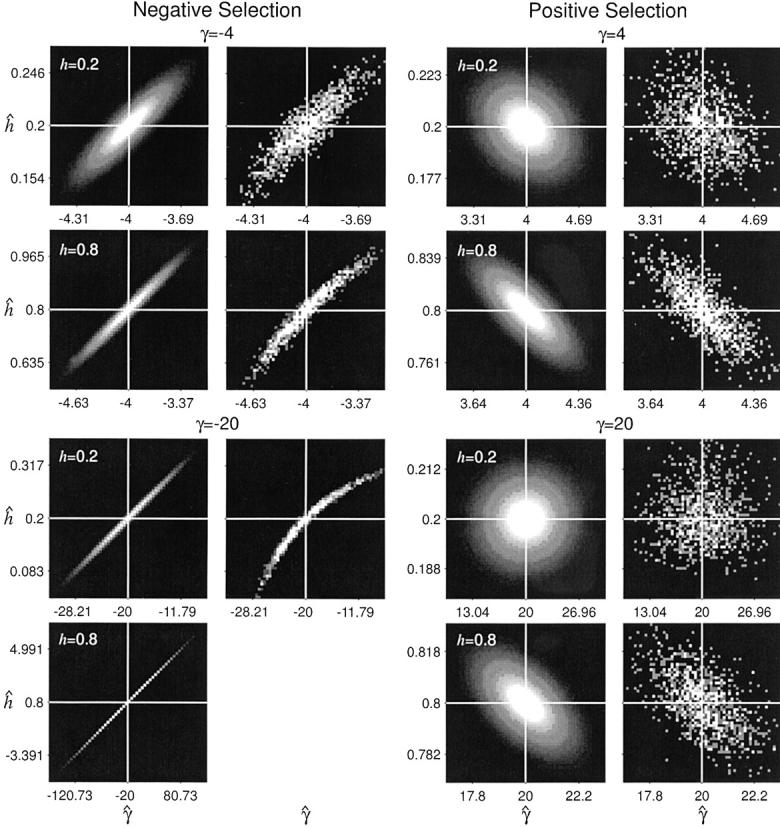
Figure 2.—

The asymptotic and simulated joint sampling distributions for maximum-likelihood estimates of the selection (γ̂) and dominance (ĥ) parameters. The white lines indicate the underlying true values. Each plot ranges ±3 asymptotic standard deviations from the true values in each axis (γ̂ and ĥ), and tick marks are drawn at ±2 asymptotic standard deviations from the means. The plots were generated with S = 10,000 and n = 25. Simulations for partially dominant, strongly deleterious mutations (γ = −20, h = 0.8) are not shown due to the computational difficulty of optimizing the likelihood function in this region of the parameter space.
