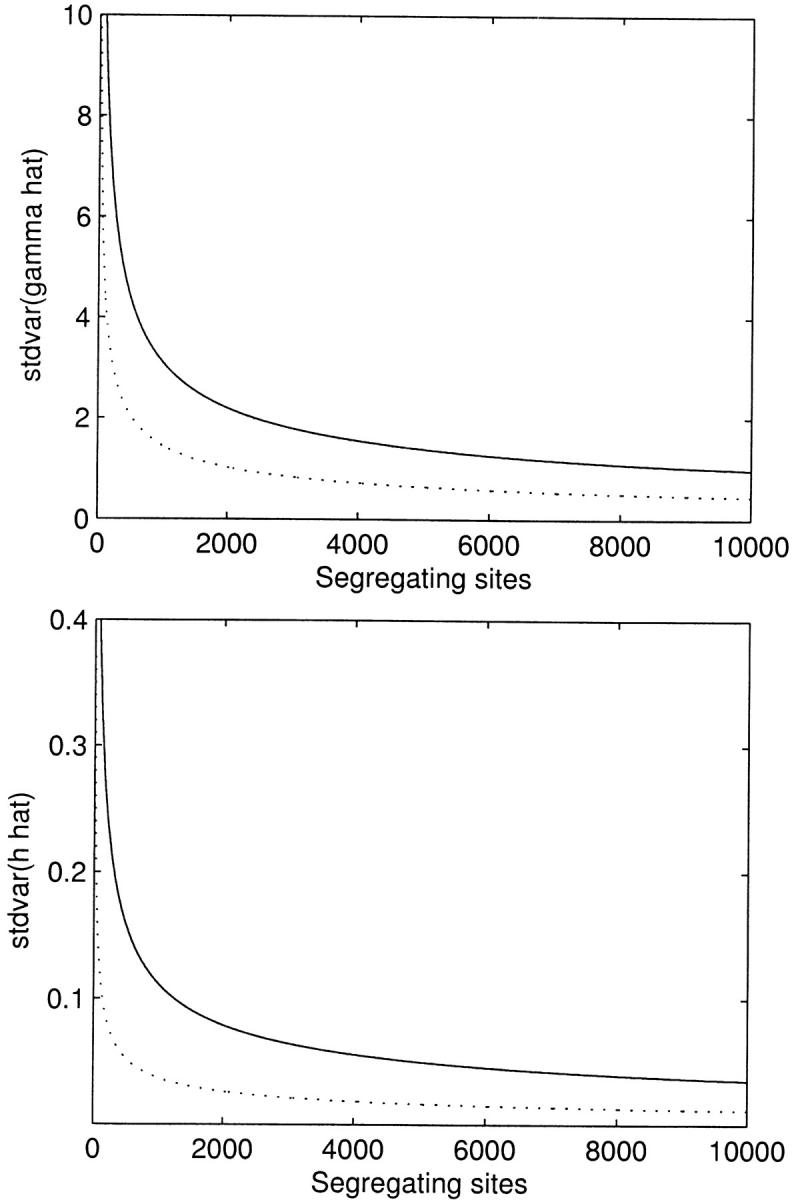
Figure 3.—

The asymptotic standard deviation of the maximum-likelihood estimates for the selection (γ̂) and dominance (ĥ) parameters as a function of the observed number of segregating sites. Solid lines represent underlying true values of γ = −10 and h = 0.2, and dotted lines represent the case of γ = 10 and h = 0.8. n = 25 for all curves.
