
Figure 5.—
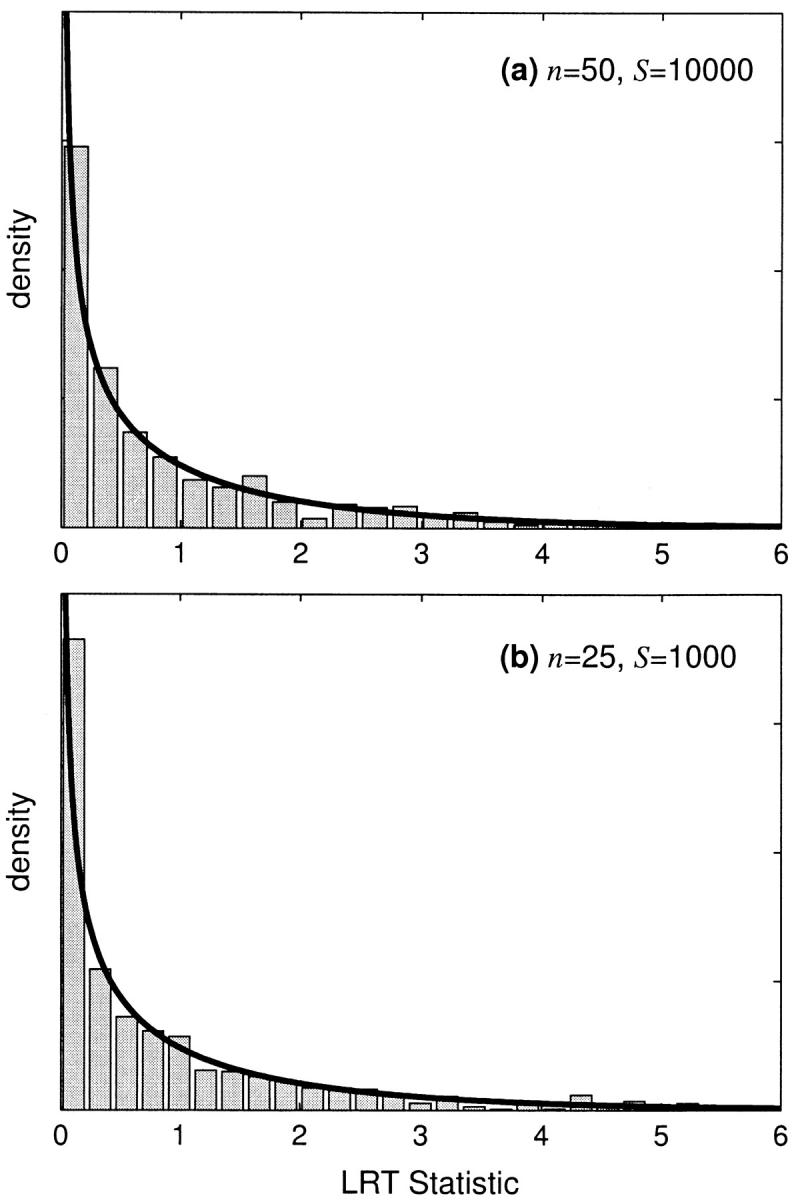
The simulated null distribution of the likelihood-ratio test statistic for nongenic selection. The null hypothesis is no dominance (h = 0.5). The solid line is the asymptotic prediction for the null distribution. Null distributions are shown for (a) weak negative selection with γ = −4 and (b) weak positive selection with γ = 4.