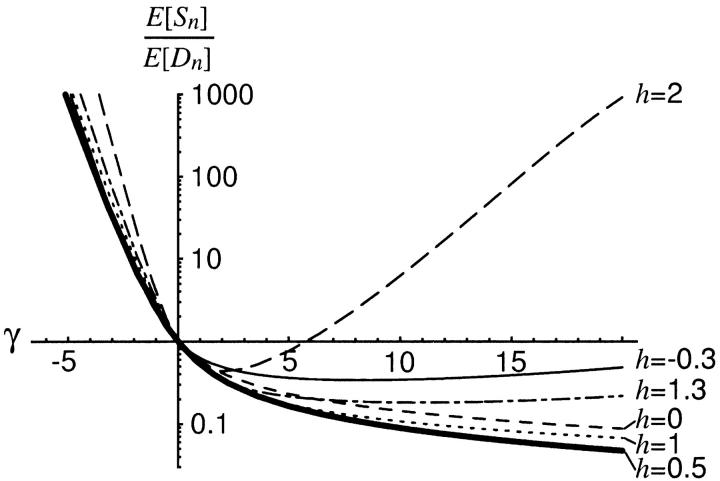
Figure 9.—
The log-transformed ratio of the expected number of polymorphisms to the expected number of fixed differences as a function of the selection parameter, γ, for several different values of the dominance parameter, h. The ratio is plotted relative to the ratio under neutrality (E[Sn]/E[Dn] = 1 at γ = 0).

