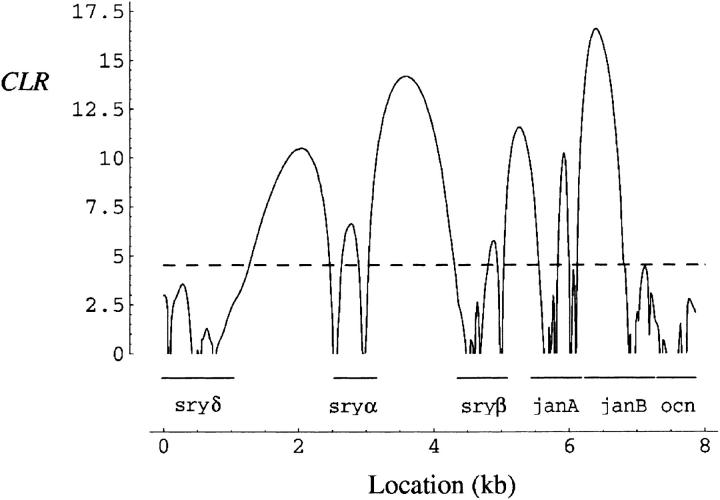
Figure 6.—
The composite-likelihood ratio (CLR) as a function of the position of the putative beneficial mutation. Sequenced segments corresponding to six genes in this region are indicated by horizontal lines above the x-axis. The CLR was obtained from 26 chromosomes corresponding to haplotype group I. The dashed line represents the 95th percentile of CLR (4.52) determined by neutral simulations.

