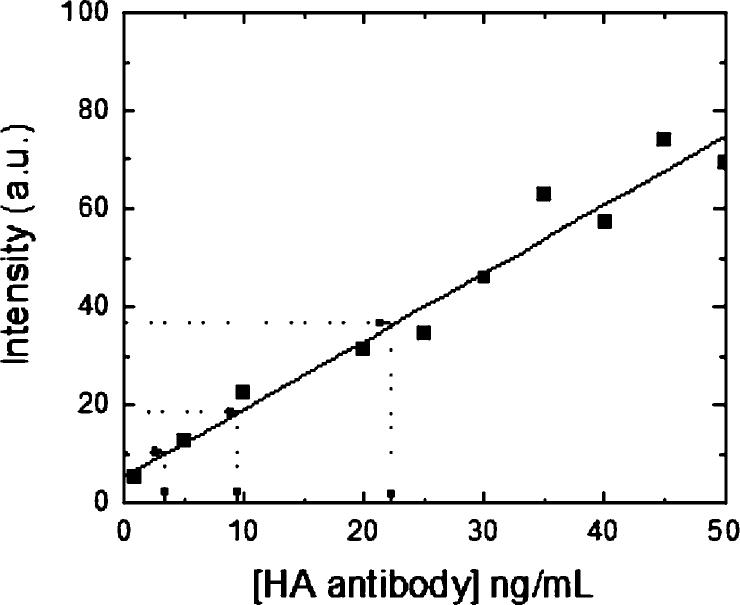
Figure 5.
Reference curve of the intensity of emitted light at a wavelength of 522 nm for different concentrations of FITC HA antibody in a 1× PBS solution with 2 vol % Triton X-100 (squares). The plain line is a linear fit to the data. Dashed lines indicate the intensity values measured for the antibody bound to neuroligin-1 incorporated in the synthetic membrane. Three samples were prepared using three different preparations of neuroligin-1, and the range of corresponding concentration of bound antibody is assumed to be directly proportional to the range of neuroligin-1 present in the synthetic membrane.

