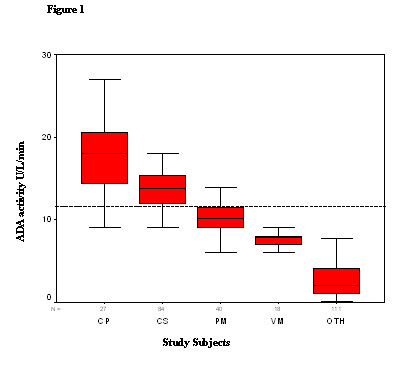
Figure 1.

Box plots of CSF ADA activity in TBM (CP-culture positive; CS-clinically suspected), non-TBM infectious meningitis (PM- pyogenic meningitis; VM-viral meningitis) and control group of non-infectious neurological disorders (OTH). The plots show the 90th percentile (bars), 75th and 25th percentile (box) and median (bar in box). N = numbers of individuals in each group. Dashed line represents the calculated ADA cut off value.
