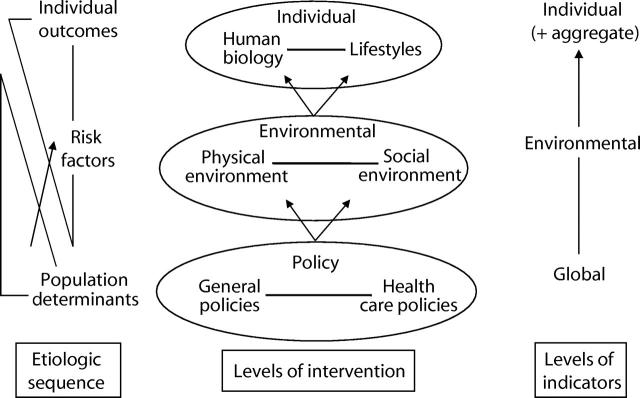
FIGURE 2—
The correspondence between population health measures and types of intervention to enhance health. Interventions may be directed at several levels (shown in the ellipses), and these correspond broadly to stages in the etiologic sequence (shown at the left of the diagram) and Morgenstern’s classification of population health indicators17 (shown at the right).

