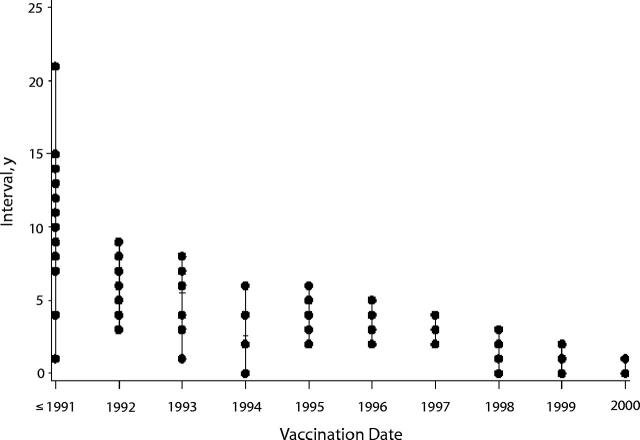
FIGURE 2—
Interval between vaccination date and report date, by vaccination date.
Note. Each dot represents an interval that occurred at least once for a given year of vaccination. For example, for reports with a vaccination date in 1996, there were 3 reports with a delay of 2 years (reports received in 1998), 4 reports with a delay of 3 years, 2 with a delay of 4 years, and 1 with a delay of 5 years.

