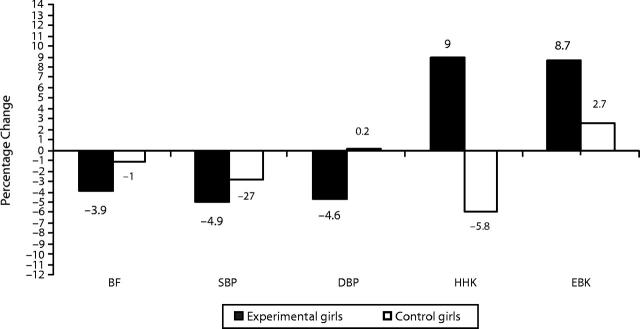
FIGURE 1—
Relative change (%) in significantly improved physical, physiological, knowledge, and behavior measures in Physical Activity and Teenage Health (PATH) vs physical education control (PED) female high-school participants: New York City, 1994–1996.
Note. BF = body fat; SBP = systolic blood pressure; DBP = diastolic blood pressure; HHK = heart health knowledge; EBK = percentage eating breakfast.

