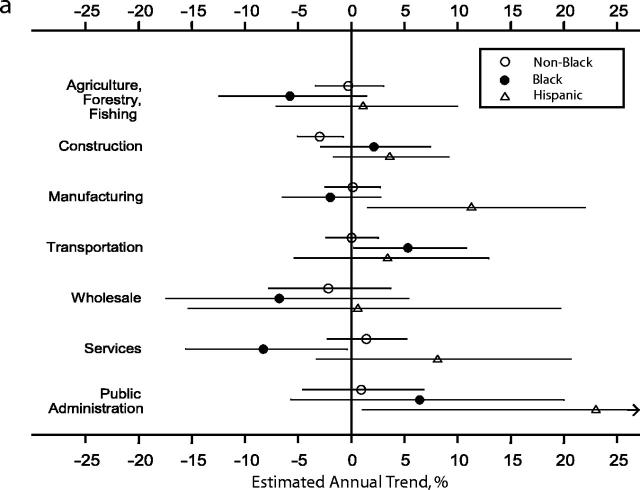
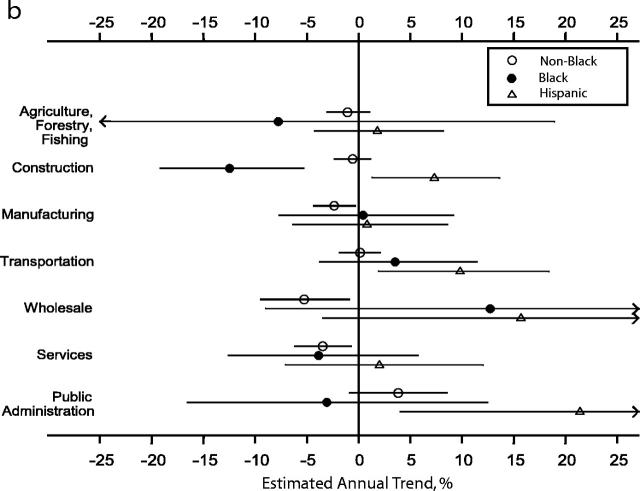
FIGURE 2—
Average annual trend in fatal occupational injury rates among men, by major industry group and race/ethnicity, 1990–1996, (a) in Southern states and (b) in non-Southern states.
Note. Results are shown for occupations in which at least 1 death occurred in each year among each race/ethnicity in each region. Error bars indicate 95% confidence intervals.


