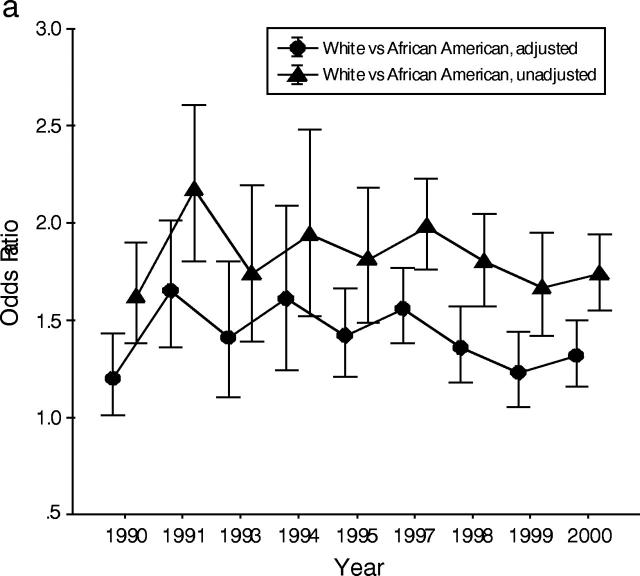
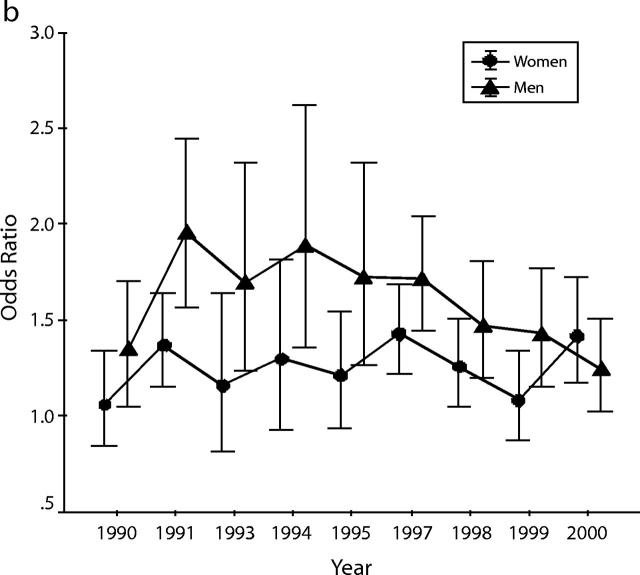
FIGURE 3—
Odds ratios for being a former vs current smoker, 1990–2000, among (a) Whites vs African Americans (adjusted and unadjusted) and (b) Whites vs African Americans (adjusted) for women vs men separately.
Note. Adjusted for covariates, age, gender, education, marital status, and geographic region.


