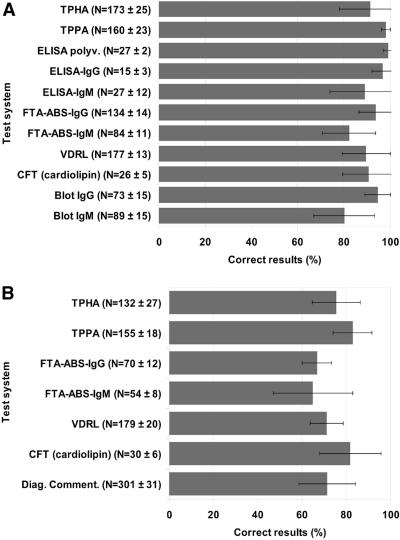
FIG. 2.
(A) Average percentage of correct qualitative test results for the given diagnostic methods used throughout the eight proficiency testing trials. Bar markers indicate an interval of ±1 standard deviation of the mean. (B) Average percentage of correct diagnostic comments and correct quantitative test results for the given diagnostic methods used throughout the eight proficiency testing trials. Bar markers indicate an interval of ±1 standard deviation of the mean. Blot, immunoblot; polyv., polyvalent.

