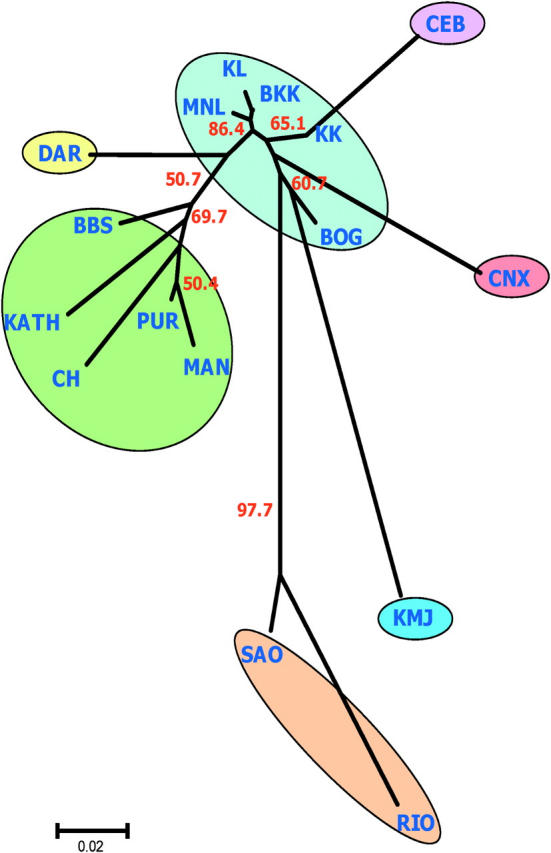
Figure 3.—

Unrooted neighbor-joining (NJ) population tree describing genetic relationships among populations. Bootstrap percentages (number in red) based on 1000 bootstrap runs are shown when the support for the internal nodes is >50%. Each colored circle represents a cluster congruent with the Structure analysis in Figure 2. Color coding is consistent with the pie diagram of Figure 2.
