
Figure 4.—
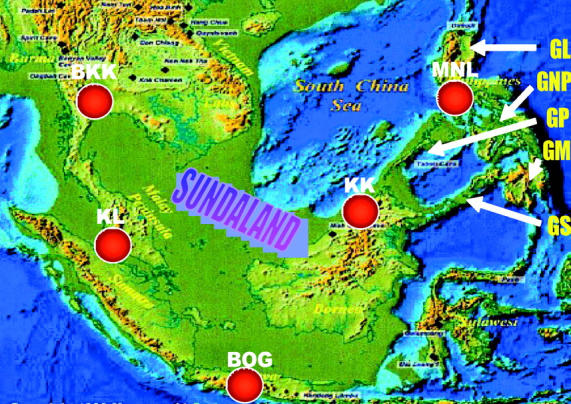
SE Asia during the height of the last Ice Age some 18 KYA. The map shows the maximum extent of dry land exposed by the lowering of the sea level in and around Sundaland. Red dots correspond to the location of the five sampling sites of the ancestral D. ananassae populations. GL, Greater Luzon; GNP, Greater Negros-Panay; GP, Greater Palawan; GM, Greater Mindanao; GS, Greater Sulu.