
Figure 2.—
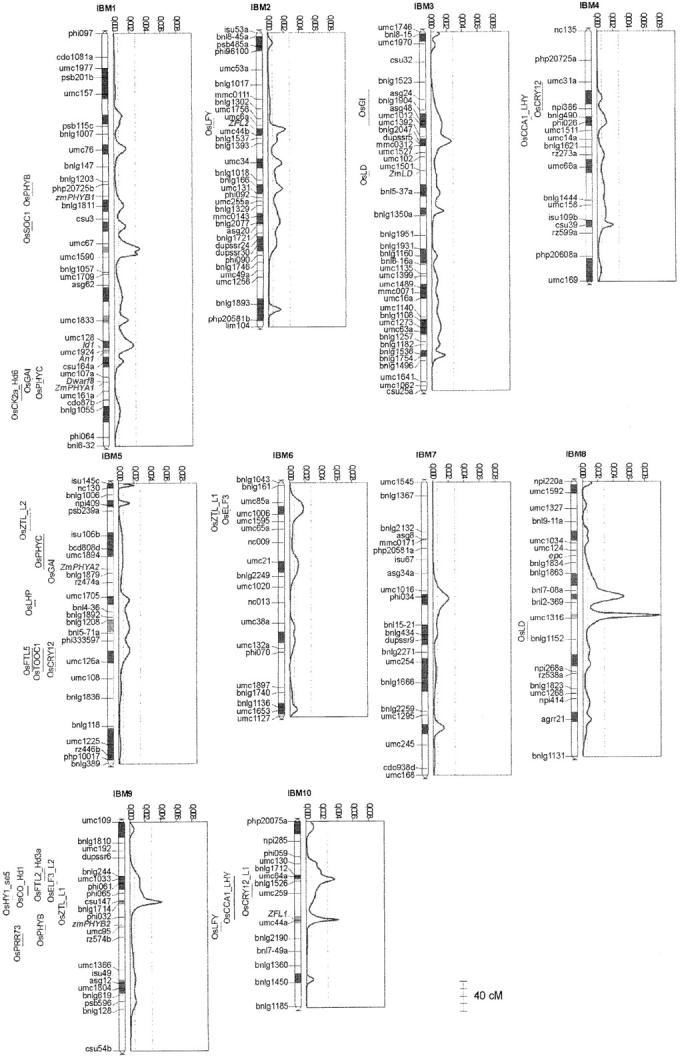
Overview and meta-analysis of QTL affecting flowering time in maize. The overview statistic was calculated every 0.5 cM and plotted along each chromosome. The two vertical dotted lines are the average value of the statistic and the threshold for “high values,” defined empirically as five times the average value. Consensus loci estimated by meta-analysis are drawn on each chromosome as darkly shaded rectangles by default and lightly shaded rectangles if they clustered QTL affecting all traits. Flowering-time genes mapped in maize are represented in italics. Positions of flowering time genes predicted on the basis of local rice-maize synteny conservation have been placed to the left of the map.