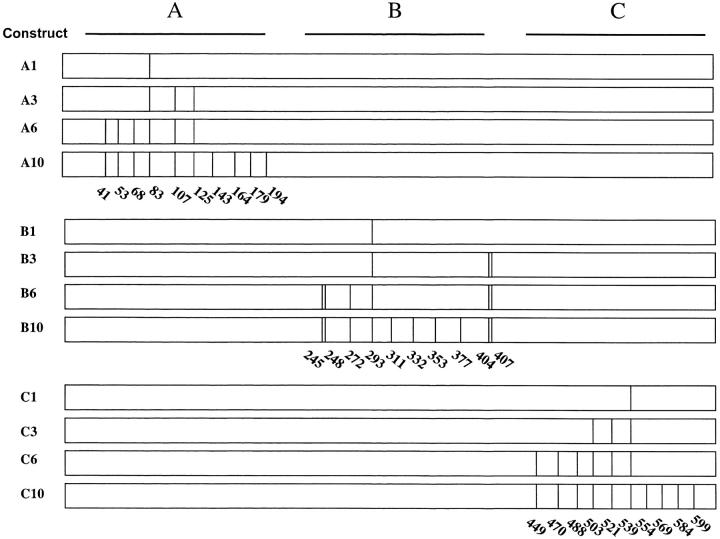
Figure 2.—
The distribution of mismatches inserted. Schematic of the 618-bp U recombination substrates that were generated by site-directed mutagenesis. Each mismatch location is indicated by a vertical line. The coordinates below the vertical lines correspond to the coordinates within the U repeat. Each construct is named on the left, according to the part of the repeat (A, B, or C) that was mutated and the number of mismatches in the repeat.

