
Figure 1.—
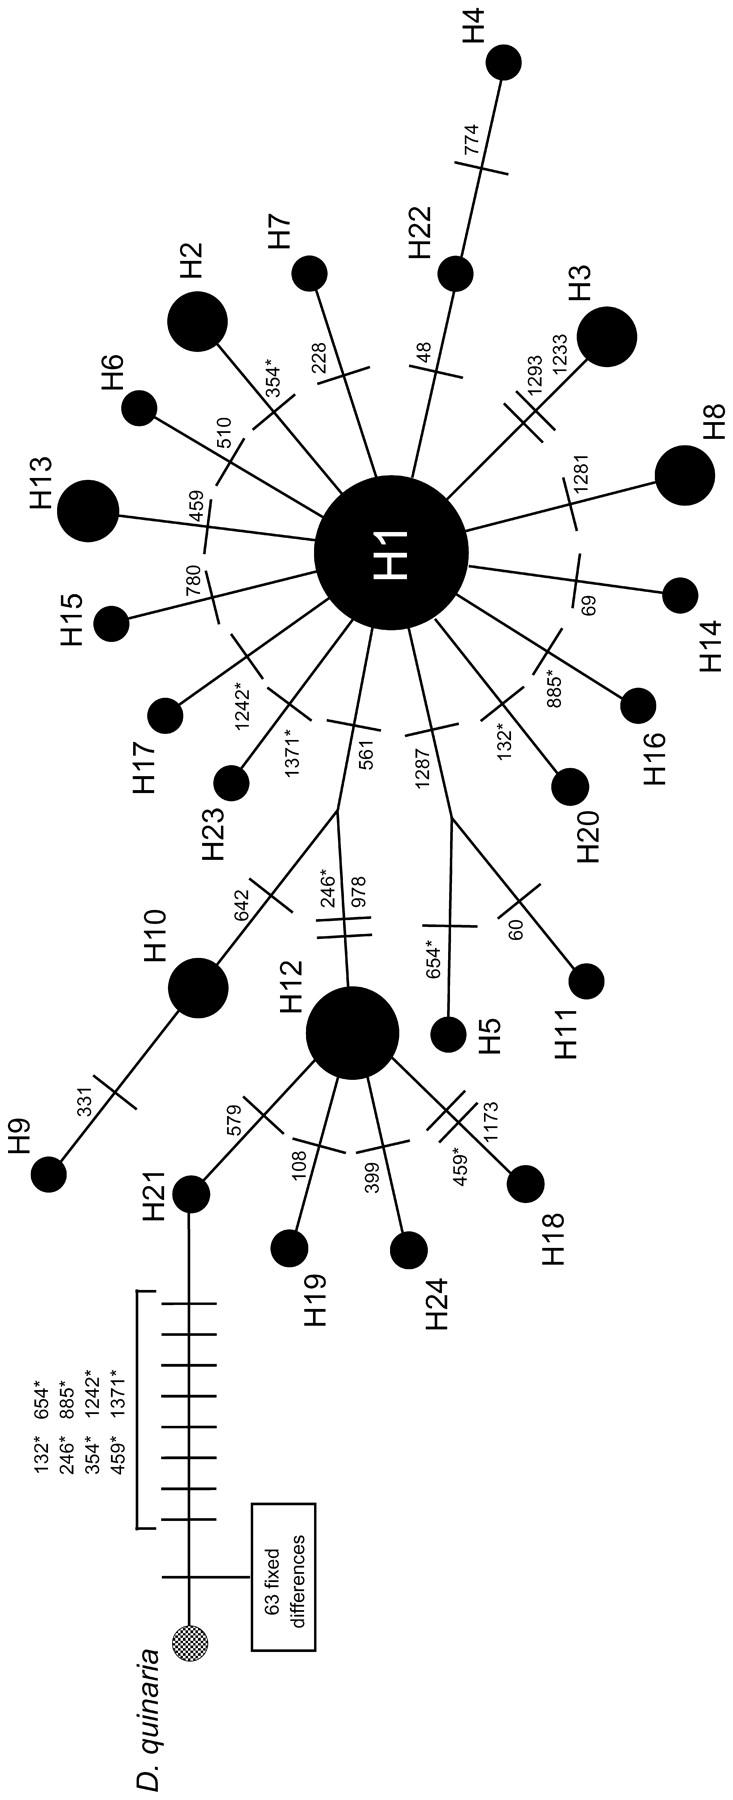
Median-joining network of mtDNA haplotypes within D. recens. The frequency of each haplotype is proportional to its area. The predominant haplotype is indicated as H1. D. quinaria is included as an outgroup. Numbers on the network indicate the base-pair positions of mutations within the mtDNA sequences. Asterisks indicate the eight inferred back mutations within D. recens.