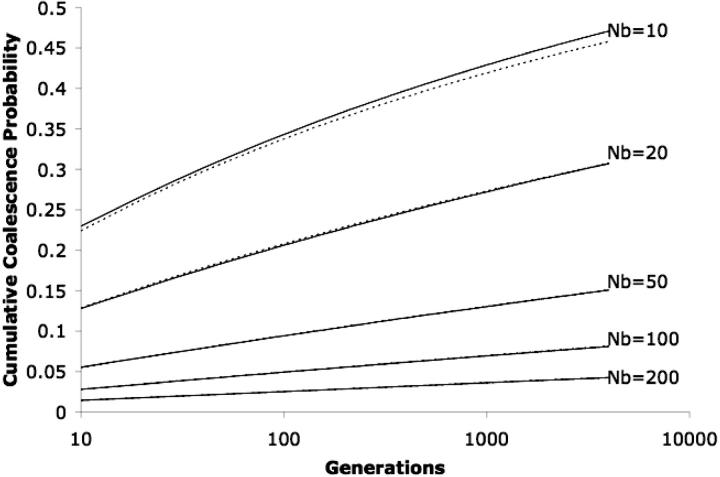
Figure 2.—
Comparison of analytic results to simulation for pairs of sequences sampled from adjacent lattice points. This graph compares simulation results (dashed lines) with results derived from Equation 2 (solid lines) for different values of Nb. Initial spacing between the two samples is 1/ , corresponding to the distance separating two neighboring points on the two-dimensional lattice. Agreement is good for values of Nb >10. No boundary effects are included in either the simulations or the analytic results.

