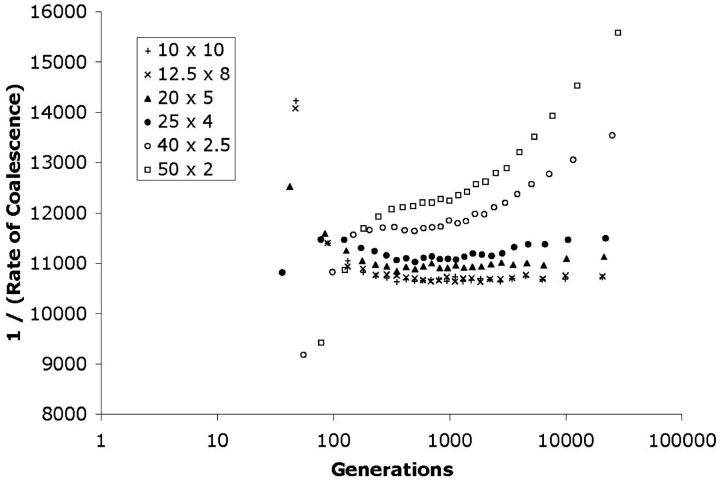
Figure 5.—
Effect of habitat geometry on the long-term coalescent process. Six skyline plots similar to those in Figure 3 are presented. In all cases, the total habitat area is 100, N = 10,000 (ρ = 100), and σ = 0.3 (Nb = 113). All habitat areas are rectangular, and the lengths L1 and L2 are given for each curve. Samples are drawn from a centered 5 × 5 grid with spacing L1/5 in one dimension and L2/5 in the other. As L1/L2 becomes large, the long-term coalescent process is no longer well approximated by a single effective population size. For a neighborhood size of 113, the condition M* > 1 holds if the ratio of lengths is <9:1. The values of M* for the plots are, from top to bottom, 0.36, 0.5625, 1.44, 2.25, 5.76, and 9.0. The four plots for which M* > 1 are close to horizontal in the collecting phase. The plots for which M* < 1 are represented by open circles and squares. The vertical crosses (10 × 10 square habitat with M* = 9.0) correspond to the conditions used to generate the skyline plots in Figure 4.

