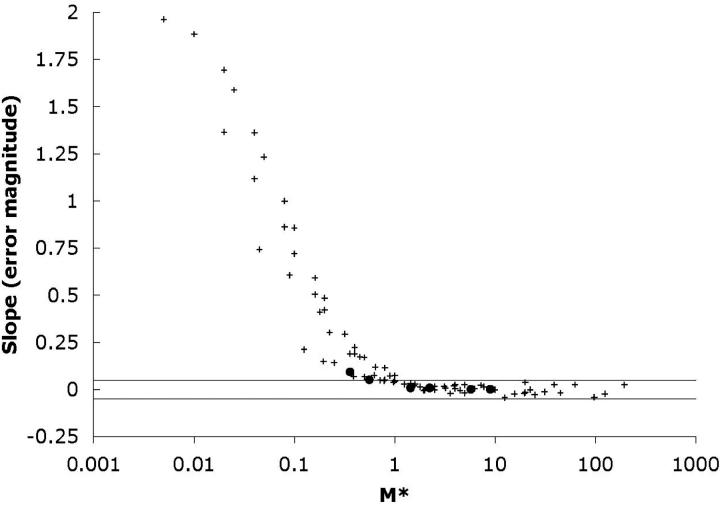
Figure 6.—
M* and the long-term coalescent process. Each point is derived from one skyline plot like those presented in Figures 4 and 5. On the x-axis is plotted M*, which equals Nσ2/L21, where L1 is the length of the major axis of a rectangular habitat. On the y-axis is the slope of the last five points for each skyline plot. Solid circles correspond to the plots in Figure 5 and are derived from 100,000 replicate genealogies. Crosses correspond to plots derived from 10,000 replicates. The two horizontal lines are placed at ±0.05. For values of M* > 1, the long-term coalescent process is well described by a single effective population size. When M* < 1, the deeper branches in the genealogy are longer than what would be expected from a constant population size process. The results represent genealogies simulated under a variety of combinations of parameter values. The ratio L1/L2 was varied from 1 to 50 (with L1 ranging between 8 and 50), the density ρ was varied from 100 to 1000, and the dispersal rate σ was varied from 0.05 to 0.5, corresponding to neighborhood sizes ranging from 3 to 3000.

