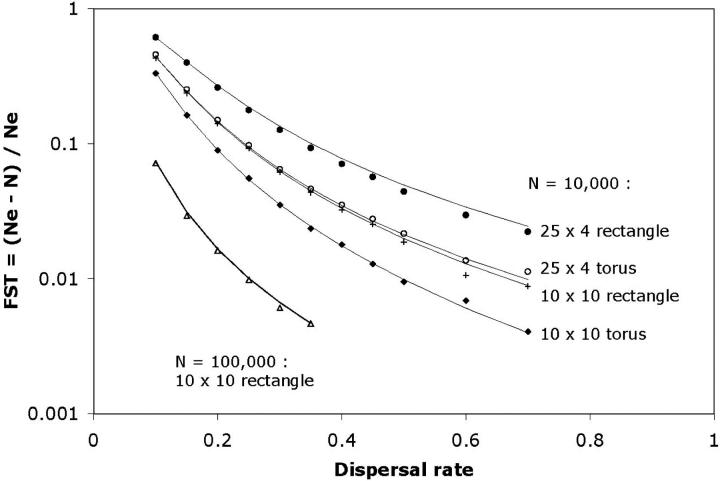
Figure 7.—
Effective population size and habitat geometry. The long-term effective population size was determined from simulations similar to those used to generate Figure 5. For each set of parameter values, 100,000 genealogies were generated, and the effective population size was taken to be the average waiting time for the last coalescent event. These values are given as FST values [(Ne − N)/Ne] for clarity of presentation. The habitats included here are a 10 × 10 torus with N = 10,000 (solid diamonds), a 25 × 4 torus with N = 10,000 (open circles), a 10 × 10 rectangle with N = 10,000 (crosses), a 25 × 4 rectangle with N = 10,000 (solid circles), and a 10 × 10 rectangle with N = 100,000 (triangles). For each of these habitats, a number of different dispersal rates (σ) were considered and are represented along the x-axis. Expected values from Equations 4 and 6 (for toroidal and rectangular habitats, respectively) are indicated by solid lines. Agreement is good over the cases considered, including conditions for which M* < 1.

