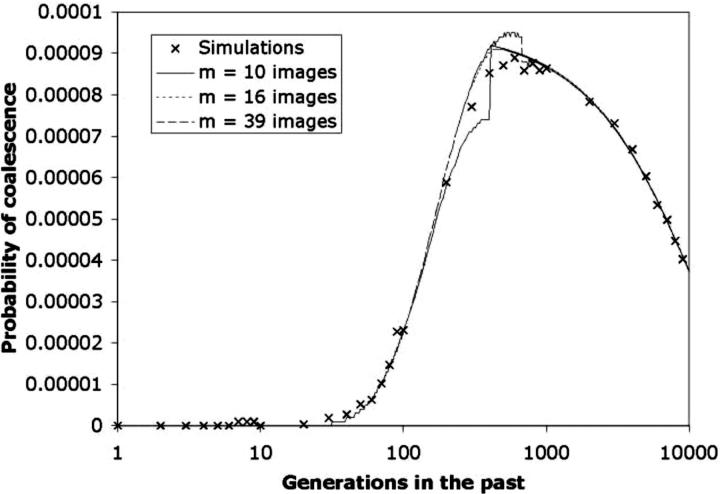
Figure 9.—
Effect of image number on the coalescence time probability distribution. This is identical to Figure 8 (N = 10,000; Nb = 113; σ = 0.3; Ne = 10,669), but with the two samples drawn from locations (2.0, 2.0) and (7.0, 9.0). Transition times were determined from Equation 8: τ = 408 for m = 10; τ = 503 for m = 16; τ = 676 for m = 39. As was the case with Figure 8, the three probability distributions are in close agreement except in the vicinity of the transition point.

