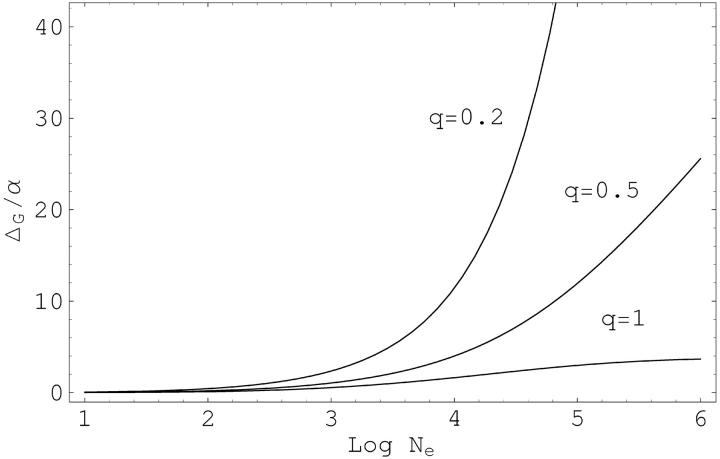
Figure 2.—
The hidden variation coefficient ΔG, in units of the epistasis parameter α, as a function of the effective population size. The three curves correspond to increasing leptokurcy of the distribution of the locus variances vo, with shape parameters q = 0.2, q = 0.5, and q = 1. The parameters for mutation rates and the average selection strength are u = 10−5 and s〈vo〉 = 1/800. For the strongly L-shaped distribution with q = 0.2, the values of 56.0α and 258.7α are reached for Ne = 105 and Ne = 106, respectively.

