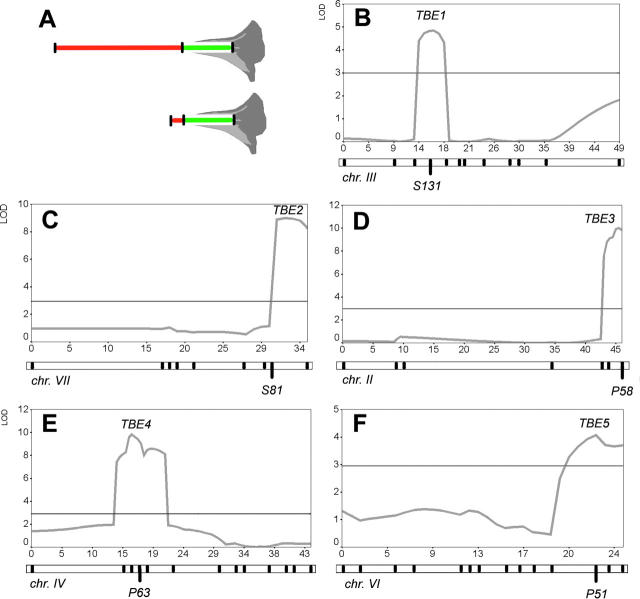
Figure 4.—
QTL maps of D1 length loci. (A) Diagram to show how a length increase of D1 (red) affects floral tube shape, if D2 length remains constant. The resulting difference in shape is essentially that of P. a. parodii (top) and P. i. inflata. (B–F) QTL likelihood profiles for chromosomes with significant associations with D1 length. Profiles are given only for the experiment in growing stand 1. Profiles for stand 2 were essentially the same, with slight differences in peak height only. TBE1 and TBE2 are derived from the WI-BIL population; TBE3-5 is derived from the WP-BILs. The chromosome maps are given below the images, with black tick marks indicating the position of markers. The chromosome numbers are given below the maps. The marker closest to the QTL likelihood maximum is named below the chromosome. The x-axes are given in centimorgans; the y-axes are given in LOD units. The horizontal lines around LOD = 3 are the significance thresholds as determined by permutations.

