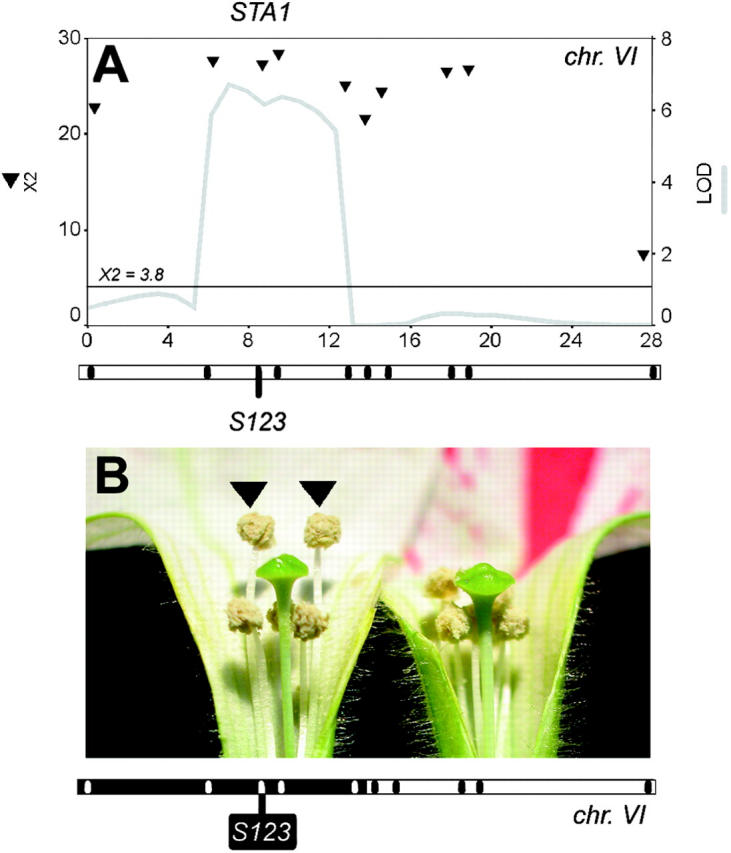
Figure 5.—

Mapping and effects of the STA1 locus for style-stamen arrangement. (A) QTL map for stamen style-stamen arrangement in the WI-BIL population. Likelihood profiles as obtained by CIM are given as a gray line. χ2 scores obtained by Kruskal-Wallis mapping are given as black triangles. Chromosome maps are below the images, with black tick marks indicating the position of markers. The marker closest to the QTL likelihood maximum is named below the chromosomes. The chromosome numbers are given below the maps. The x-axes are given in centimorgans the y-axes are given in LOD units (right axis) or χ2 values. The horizontal line at X2 = 3.8 gives the significance threshold of a χ2 distribution with 1 d.f. (B) Phenotype of the STA1 introgression line. The position of the P. i. inflata chromosome segment introgressed into W138 is given in black on the chromosome map below the graph. Note that in the IL, the two ventral stamens extend above the style (arrows), an arrangement that is typical of P. i. inflata.
