Figure 7.—
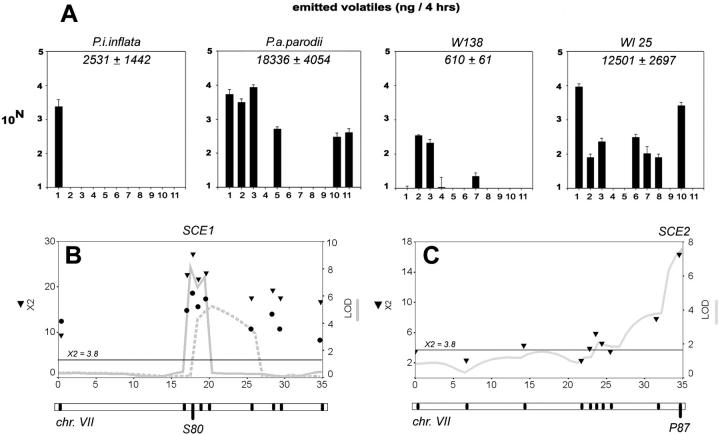
Fragrance. (A) Floral fragrance composition of species and lines. Odors were collected from the headspace of individual flowers and analyzed by gas chromatography coupled to mass spectrometry. Note that the scale is logarithmic (log com). The total amount of volatile produced (average ± SE in nanograms/flower/4 hr) is indicated in the top right of the panels: 1, benzaldehyde; 2, benzylalcohol; 3, methylbenzoate; 4, phenylethylalcohol; 5, methylsalicilate; 6, eugenol; 7, vanillin; 8, isoeugenol 1; 9, isoeugenol 2; 10, benzylbenzoate; 11, benzoic acid; 2, hydroxy, phenyl methyl ester. (B and C) QTL maps for fragrance intensity per flower on WI-BILs chromosome VI (B) or WP-BILs chromosome VII (C). Likelihood profiles obtained by CIM are indicated by a shaded line. Solid lines and dashed lines in B denote profiles obtained by independent observers. χ2 scores per marker from Kruskal-Wallis mapping are given as solid triangles or solid dots. Dots or triangles denote scores obtained by independent observers. The chromosome maps are given below the images, with black tick marks indicating the position of markers. The marker closest to the QTL likelihood maximum is named below the chromosomes. The chromosome numbers are given below the maps. The x-axes are given in centimorgans; the y-axes are given in LOD units (right axis) or χ2 values. The horizontal line at X2 = 3.8 gives the significance threshold of a χ2 distribution with 1 d.f.

