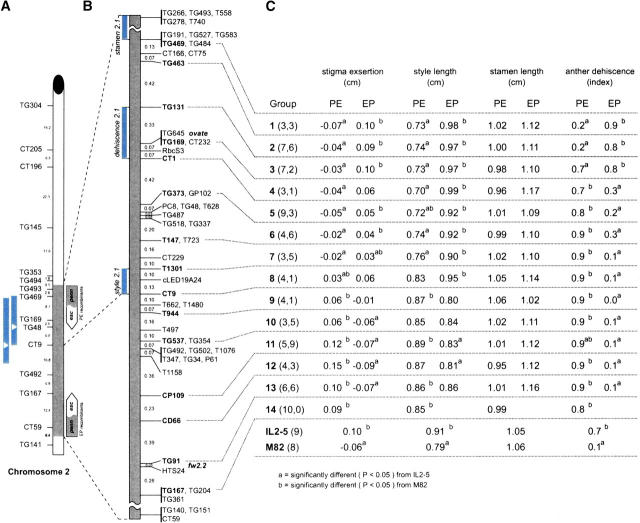
Figure 2.—
Fine mapping the se2.1 QTL on tomato chromosome 2. (A) The genetic map of chromosome 2 showing the L. pennellii introgressed region (gray) in IL2-5. The genetic distance between markers is from the tomato RFLP high-density map (Tanksley et al. 1992). Two short bars to the left show the location of se2.1 QTL from two previous mapping studies (Bernacchi and Tanksley 1997; Fulton et al. 1997). The white triangle inside a bar represents the location of the most significant marker associated with stigma exsertion in each study. Two arrow bars to the right show the portion of the L. pennellii introgression region (gray) in the PE and EP recombinant groups (esc, L. esculentum cv. M82 DNA; penn, L. pennellii DNA). (B) The high-resolution genetic map between markers TG469 and TG167 derived from this study. The order and map distance between markers is based on 123 crossovers in the interval derived from the screening of 1535 F2 plants. Markers separated by commas cosegregate. Bars on the left indicate the location of loci as deduced from this study: style length (style2.1), stamen length (stamen2.1), and anther dehiscence (dehiscence2.1). (C) The phenotypic means of each trait in different grouped recombinant families. PE groups represent the recombinants containing pennellii DNA from the proximal end of the introgression (TG493) down to the recombination point. EP groups represent the recombinants containing L. pennellii DNA from the distal end (CT59) up to the recombination point. The two numbers in parentheses represent the number of recombinant families in PE type (the first number) or in EP type (the second number). The numbers in parentheses after IL2-5 and M82 represent the number of the replicated control plants.

