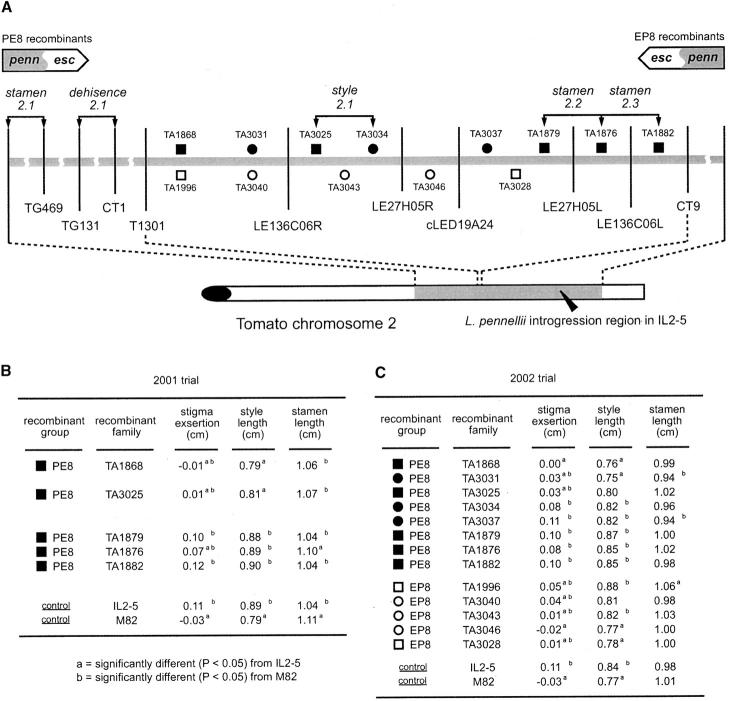
Figure 3.—
(A) Fine mapping of the style2.1, stamen2.1, -2.2, -2.3, and dehiscence2.1 on chromosome 2. Squares and circles represent the chromosomal location of crossover events in each recombinant family. Solid squares and circles represent the PE8 recombinant families. Open squares and circles represent the EP8 recombinant families. Squares represent the recombinants derived from the F2 population presented in Figure 2. Circles represent the recombinants derived from an additional F2 population. Vertical lines represent the marker locations. For those markers derived from BAC ends, an R or L was added after the BAC clone name to indicate the right or left ends of the cloned tomato chromosomal fragments, respectively, as defined by Woo et al. (1994). Two arrow bars at the top show the portion of L. pennellii introgression region (gray) in the PE8 and EP8 recombinant families (esc, L. esculentum cv. M82 DNA; penn, L. pennellii DNA). (B) Phenotypic values and comparisons for 2001 trial. (C) Phenotypic values and comparisons for 2002 trial.

