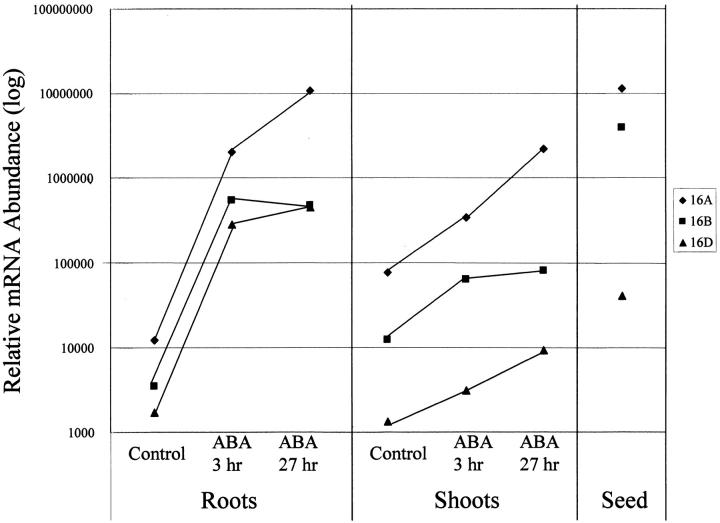
Figure 6.—
Relative expression of rice rab16A, rab16B, and rab16D. Standard curves for qRT-PCR were generated using a dilution series of known amount of BAC DNA template to correct for differences in primer efficiency to determine absolute abundance of mRNA per gene under each condition examined. The corrected mRNA abundance for Osrab16A (♦), Osrab16B (▪), and Osrab16D (▴) is plotted for roots and shoots in control and for ABA-treated tissue at 3 and 27 hr as well as for seeds.

