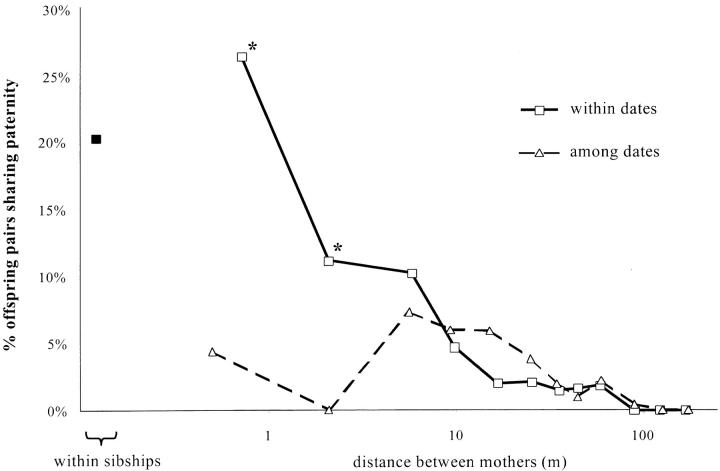
Figure 1.—
Percentages of offspring pairs sharing paternity within maternal sibship (solid symbols) and among sibships according to the distance (log scale) separating the mothers (open symbols). We distinguish pairwise comparisons including offspring sampled the same date (squares, solid line) or at different dates (triangles, dashed line). For pairwise comparisons within sibships and among sampling dates, no value is given because there were only five pairs. The asterisks show estimates within sampling dates that are significantly higher than estimates between sampling dates. These results are based on 121 outcrossing events identified by paternity analysis.

