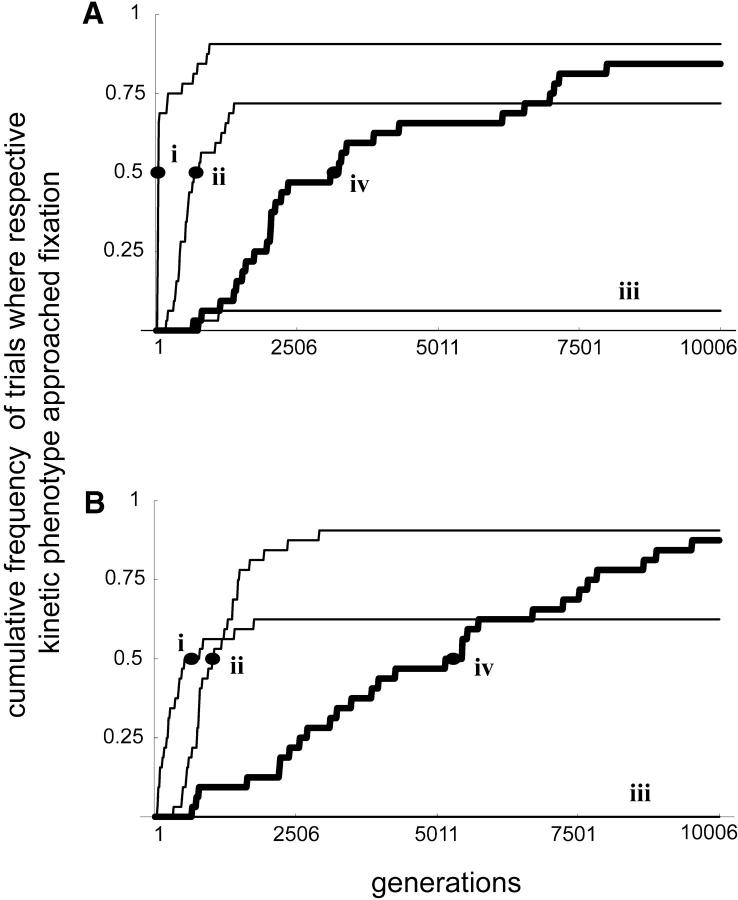
Figure 7.—
Comparison of fixation-approach times for different phenotypes in the two-allele scenario. Each line represents pooled data from 32 trials. Fixation approach was scored when respective phenotype frequencies surpassed 0.95. Each labeled dot represents the median number of generations at which half of the trials had first gone above a frequency of 95% for the given kinetic phenotype. (A) Full linkage. (B) Free recombination. i, high E1, high E2, low kcat1, low kcat2; ii, high E1, high E2, high kcat1, low kcat2; iii, high E1, high E2, low kcat1, high kcat2; iv, high E1, high E2, high kcat1, high kcat2.

